Automating Equity Research with AI Agents
Equity research has always had a strange split personality.
While on one hand, it is deeply analytical—valuation multiples, technical signals, sector context, earnings quality, news flow, and risk factors—on the other hand, it is painfully manual: too many tabs, too many dashboards, too much copy-pasting, and too much time spent stitching everything together into one coherent view.
In this blog, we will talk about a project where we built a multi-agent equity research workflow that takes a simple user question like:
“Should I look at Microsoft as a long-term growth investment?”
and turns it into:
- Structured market data
- Technical and fundamental analysis
- Chart generation
- A final report with objective insights, reasoning, plot interpretation, and exportable output
The goal is not to replace thoughtful investing.
The goal is to remove the repetitive, fragmented, and boring parts of research so the human can spend more time on judgment.
The Problem: The “Research Tax” on Intelligence
Before diving into the solution, let’s first look at the kinds of friction that exist in modern finance and why they matter.
Today, retail investors and emerging fund managers face a Research Tax that manifests in two ways:
-
The Financial Barrier
Bloomberg-grade research and institutional terminals often cost north of $2,000 per month. This prices out talented independent researchers, forcing them to cobble together free sources that are often delayed, fragmented, or missing thesis-breaking footnotes found in SEC filings. -
The Cognitive Drain
Professional analysts report spending up to 60% of their time simply gathering and cleaning data—toggling between EDGAR for filings, Yahoo Finance for prices, and news terminals for sentiment.
This creates an Information Gap where the person with the best insight often loses to the person with the fastest API or the biggest data-entry team.
We built this system to democratize that access, turning the “data gathering” phase from a multi-hour chore into a multi-second background task.
The Tech Stack
To move from a simple prompt to a high-fidelity report, we utilized a modern AI stack designed for orchestration and reliability:
- LLM: Gemini handles reasoning, intent classification, and final report synthesis
- Agent Creation & Orchestration: LangGraph manages the stateful multi-agent workflow
- User Interface: Streamlit provides an interactive dashboard for research input and visualization
Why Equity Research Feels So Fragmented
If you have ever researched a stock, you know the drill.
You check the price and recent performance.
Then you open another tool for indicators.
Then another for company financials.
Then another for peers.
Then you read headlines.
Eventually, you try to mentally combine all of it into one answer to a deceptively simple question:
“What do I actually think about this stock?”
The hard part is not just finding data.
The hard part is moving from disconnected signals to a structured overview.
This is where an agent-based design becomes useful. Instead of asking one giant model to do everything in one shot, the workflow is broken into specialized stages, each with a focused responsibility and a validated, structured output.
The High-Level Workflow
At a conceptual level, the system follows a simple pipeline:

Each stage transforms the output of the previous stage, ensuring data integrity before any narrative is formed.
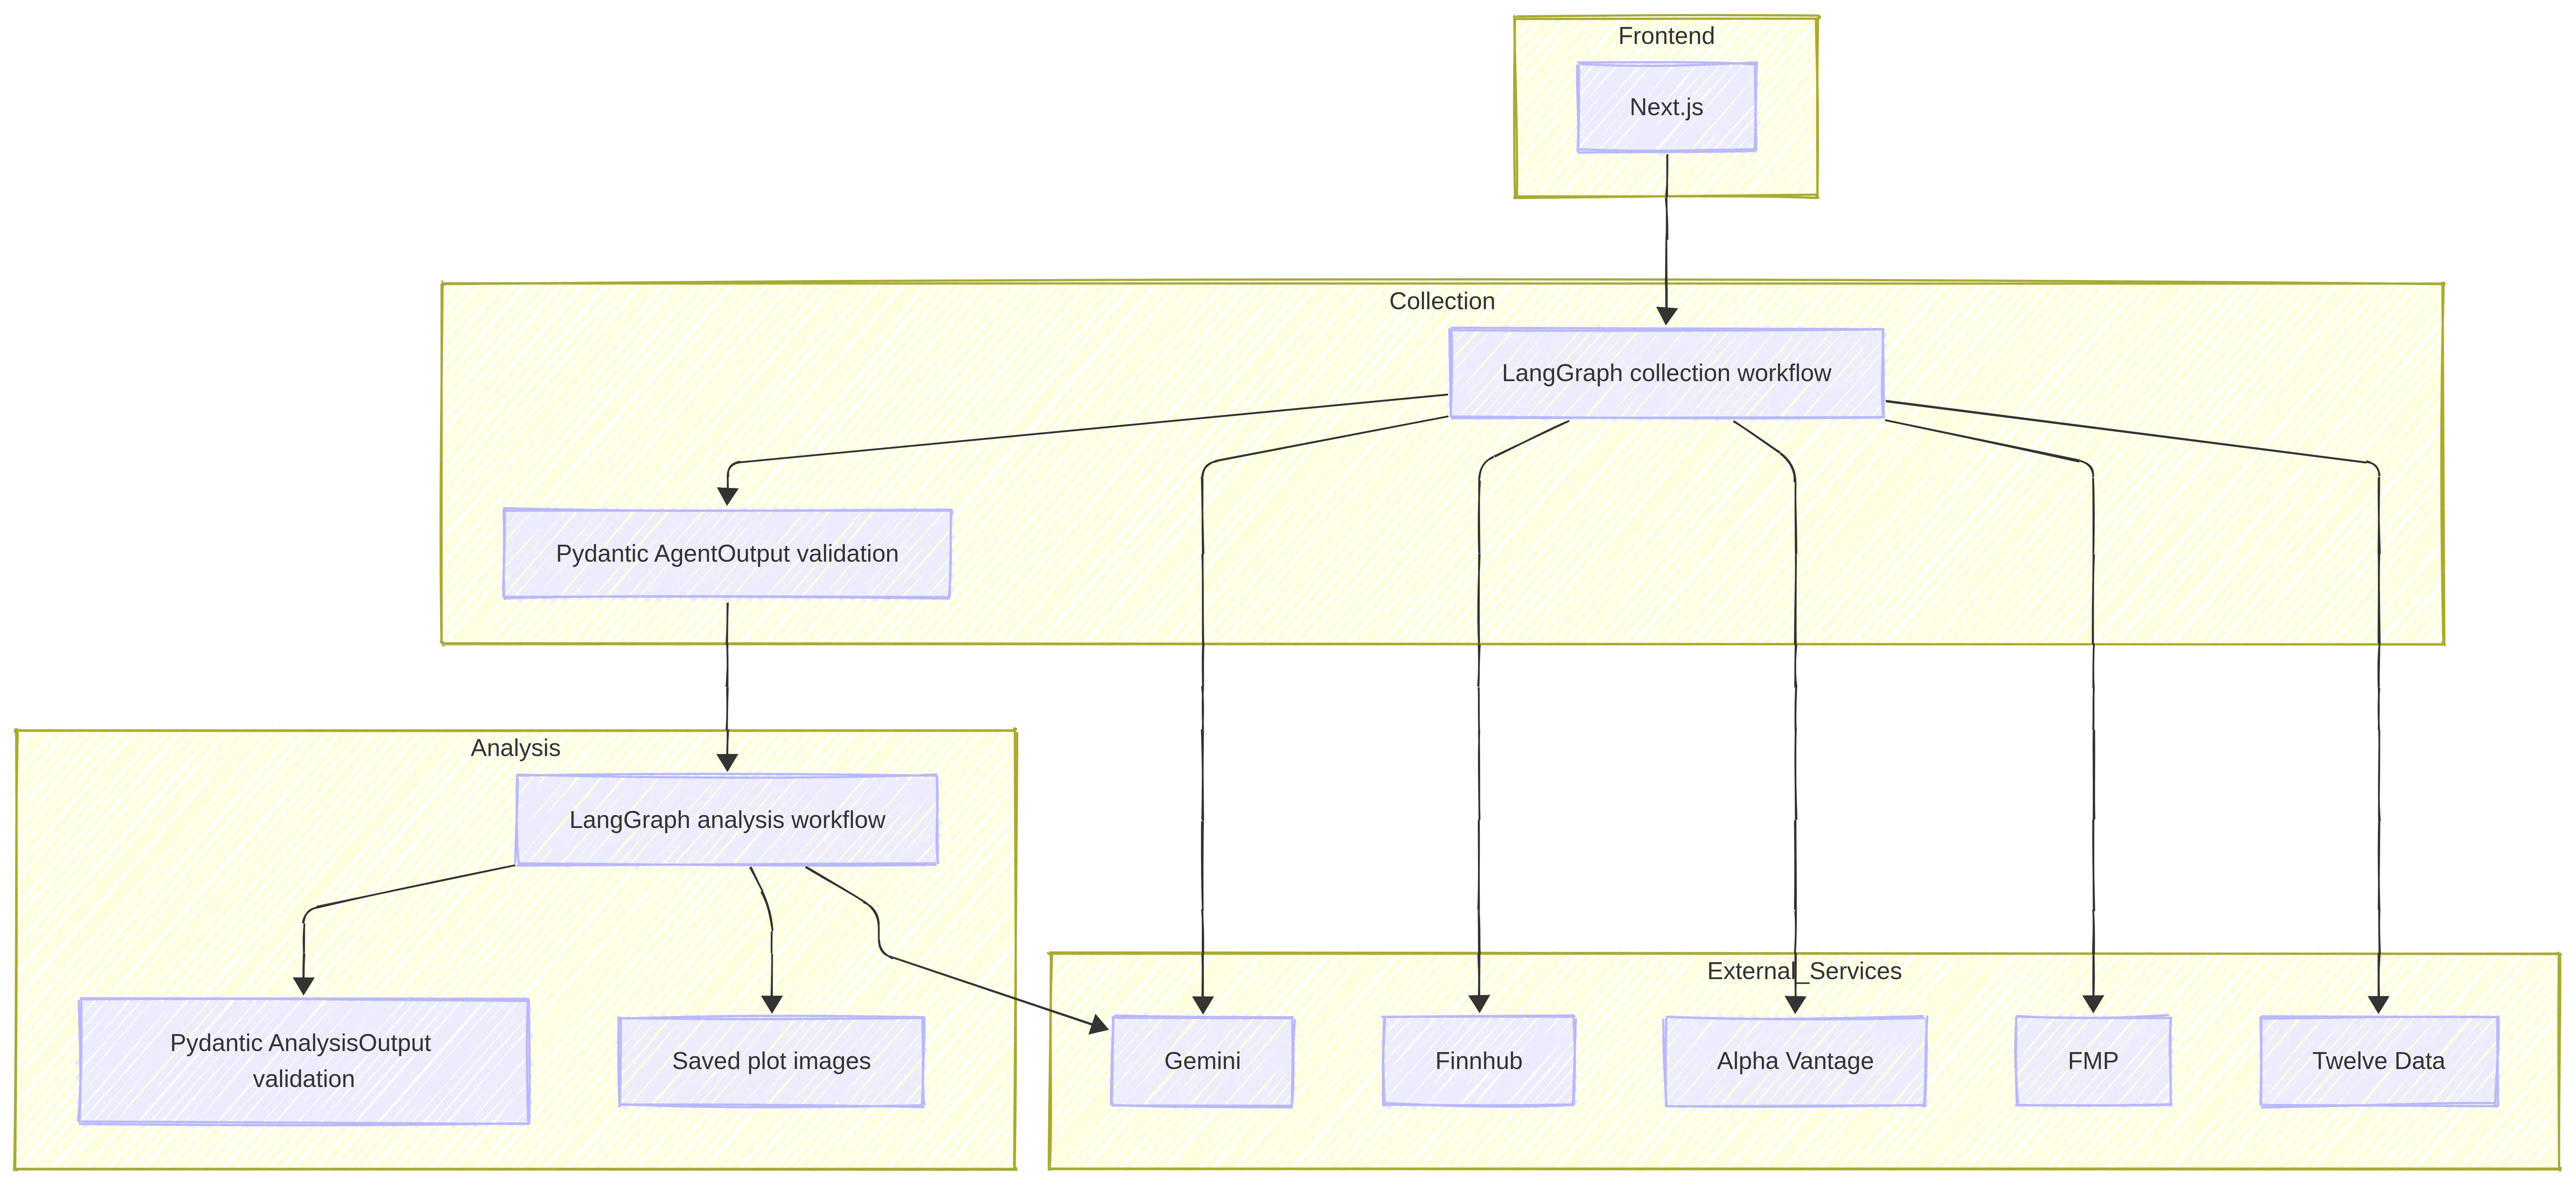
The System Design
The diagram below shows the full end-to-end structure of the system—from the user interface through data collection, analysis, and reporting.
User Query Processing
The easiest way to understand the system is to imagine a compact research desk made of AI-powered specialists.
1. The Intake Desk
The process starts in a Streamlit interface.
The user types a plain-English request, provides a Gemini API key, and kicks off the workflow.
This interaction is intentionally conversational. A user should not need to remember exact ticker formatting or speak in machine-friendly syntax.
If they say “Apple” instead of AAPL, that is fine.
If they say they want a long-term growth view, the system should understand that too.
2. The Symbol Resolver
Before any analysis happens, the system needs to know what the user is talking about.
The symbol resolver:
- Accepts either a ticker or a company name
- Maps names to the correct exchange-listed symbol
- Detects ambiguity and pauses the workflow for clarification when needed
3. The Intent Classifier
Once the symbol is known, the system determines how the user wants the stock analyzed.
Different users care about different things—momentum, growth, valuation—depending on their focus and time horizon.
The intent classifier extracts:
- Overall goal (investing vs trading)
- Time horizon (short-term vs long-term)
- Primary focus (technical, fundamental, mixed)
- Framing expectations for charts and signals
This matters because “analyze Nvidia” is not one task.
Intent directly influences which data is collected, which charts are generated, and how conclusions are framed.
The Data Collection Agent
The data collection agent assembles the evidence by pulling from multiple market data providers:
- Current price and historical time series
- Technical indicators
- Fundamental metrics
- Sector and peer context
- Recent headlines and sentiment
A key design choice is that this agent does not reason.
It only fetches and validates data into a research-ready case file for downstream analysis.
From Data to Judgment: Analysis + Visualization
Once the collection is complete, the workflow converts raw data into structured signals and visual interpretations.
Technical and Fundamental Analysis
The analysis stage evaluates trend direction, momentum, business quality, and valuation.
Rather than producing a single score or recommendation, the system generates objective insights.
For example, instead of stating a raw P/E ratio, it provides context:
“The company’s valuation is in the top quartile of its sector, suggesting high growth expectations from the market.”
Interpretation of Visualizations
Charts are treated as first-class analytical evidence.
The system generates:
- Momentum-oriented views for shorter horizons
- Trend and comparison views for longer horizons
Crucially, the analysis agent produces explicit visual insights derived from those plots, ensuring that charts in the final report are always accompanied by a clear explanation.
The Final Step: Report Generation
The report generator sub-agent reads structured signals and visual interpretations to produce a readable research artifact.
The output includes:
- Objective Insights: Synthesized data points and fundamental health
- Interpretation of Visualizations: What the charts reveal about trends and price action
- Risks and Notes: Caveats, volatility considerations, and data limitations
Because the report is built from validated intermediate outputs, it is both explainable and reproducible.
Guardrails, Scope, and Safe Interaction
A core design principle of the system is to be useful without being misleading.
Strict Query Scope Enforcement
The system intentionally supports:
- Single-stock queries only
- U.S.-listed equities only
Out-of-scope queries—such as sector-wide analysis or multi-stock screening—are detected early and paused deliberately.
This is a human-in-the-loop interruption, not a failure.
Once corrected, the workflow resumes from the point of interruption.
UI-Level Scope Indicators
The interface communicates constraints clearly:
- The input field specifies single U.S. stock queries only
- Out-of-scope requests trigger explanatory messages instead of silent failures
Chat With Report: Controlled Q&A
Beyond static output, the system supports a “Chat with Report” mode.
Users can:
- Ask follow-up questions
- Request clarifications
- Ask for summaries or rephrasings
This chat is deliberately constrained:
- The final report is injected into the LLM context
- Responses must be grounded in the report
- New analysis or advisory behavior is blocked
These guardrails ensure clarity without expanding scope.
What This System Does Not Claim
It is important to be explicit about the limits:
- No recommendations (no Buy / Hold / Sell)
- Human judgment required
- Data-dependent accuracy
- No multi-stock or sector queries
- U.S. markets only
Conclusion
Equity research will always involve nuance and ambiguity.
By letting AI agents handle the manual gathering and structuring of data, the human analyst can focus on the only question that truly matters:
“Given these objective insights, what do I believe?”
That is a far better use of attention than juggling ten browser tabs and a spreadsheet.