Methods of signal alignment
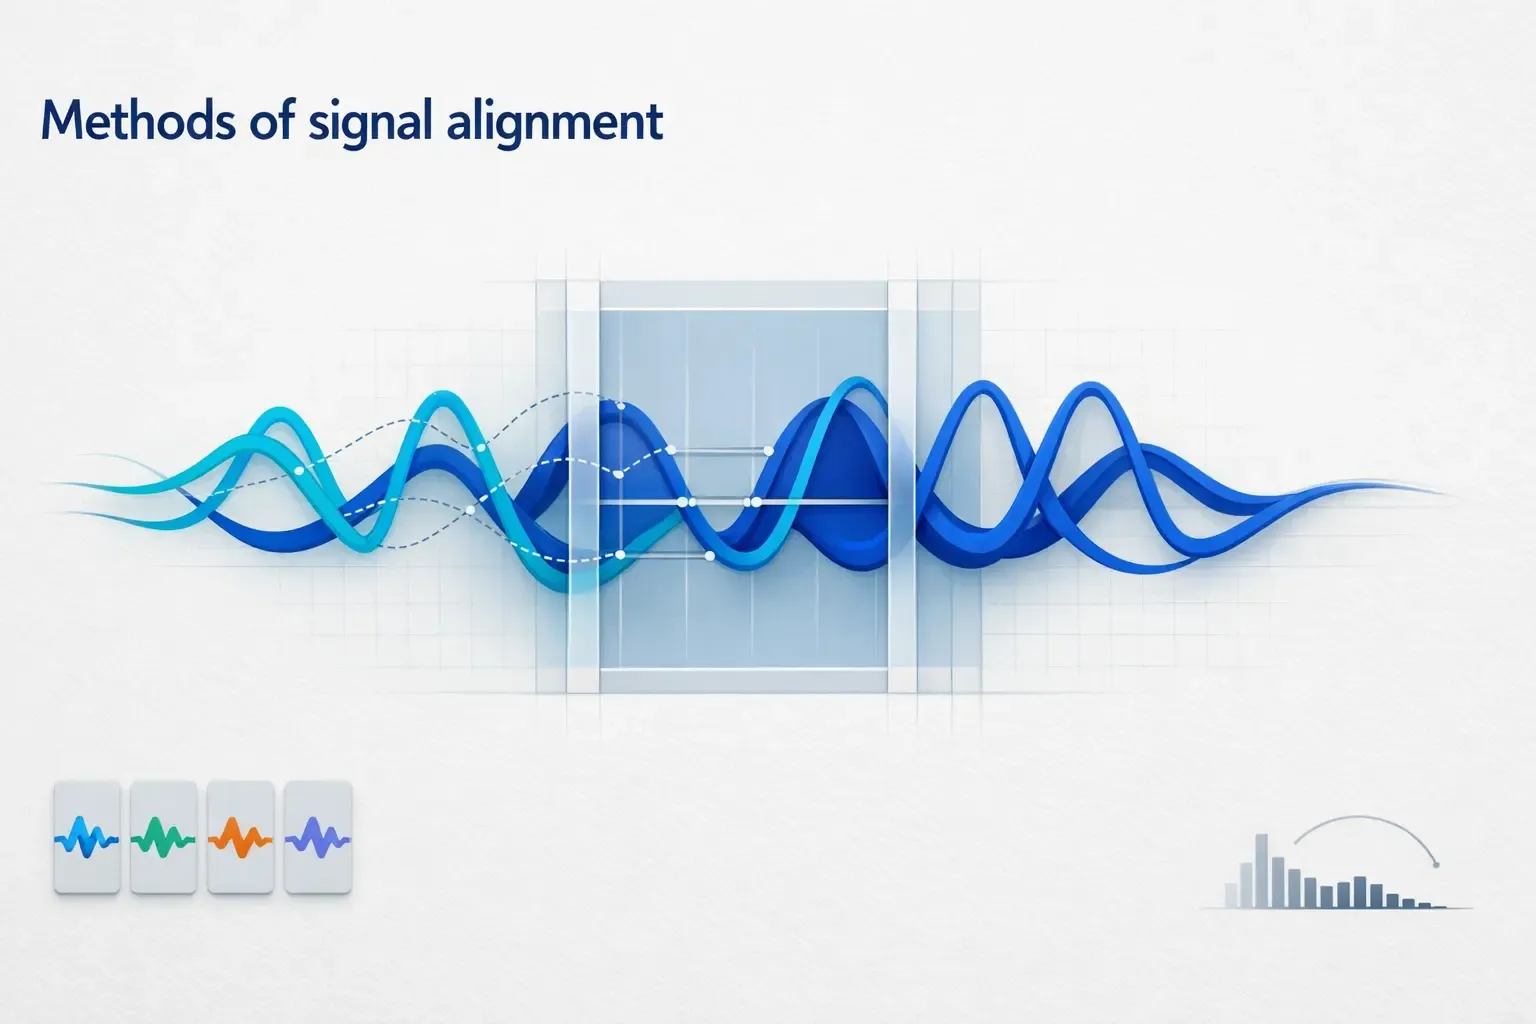
Introduction
You know that feeling when you’re listening to music and the drums don’t quite match the tempo, or the vocals feel just a hair late? It’s uncomfortable—something’s clearly off. Now apply that same concept to data.
In fields like neuroscience, radar, communications, and audio processing, we often deal with multiple signals that are supposed to reflect the same event or measurement. But in practice, these signals are rarely perfectly aligned. Even small timing discrepancies—what we call phase shifts—can distort analysis and lead to incorrect conclusions.
Signal alignment is the process of correcting those shifts so the signals can be meaningfully compared, combined, or analyzed. And it’s not always as simple as sliding one signal to the left or right—especially when the misalignment isn’t constant.
In this post, I’ll walk you through why alignment matters, what causes misalignment, and the four main techniques we use to fix it. Whether you’re syncing brainwave recordings or trying to clean up multi-sensor data, these tools will give you a solid foundation.
Why Do Signals Drift Out of Sync?
Let’s start with the basics. Imagine two people clapping together. They start in sync, but one begins to speed up just slightly while the other slows down. After a few moments, their rhythm is completely out of step.
That’s more or less what happens with signals over time. A few common causes:
- Different sensor latencies
- Sampling rate mismatches
- Transmission delays
- Environmental interference
- Internal clock drift
These issues cause what we call time-varying phase differences. The important features of the signal—peaks, valleys, trends—don’t line up the way they should. That makes it harder to analyze patterns, detect events, or compare across data sources.
Why Alignment Matters
You might be wondering—can’t we just analyze each signal on its own?
Sure, sometimes. But if you’re working with multi-channel EEGs, radar signals, sensor networks, or even just stereo audio, alignment is essential. Here’s what syncing signals lets you do:
- Improve accuracy: Cleaner comparisons mean better insights.
- Preserve features: Avoid distorting key elements like peaks or frequency shifts.
- Support real-time systems: Misalignment can wreak havoc on low-latency pipelines.
- Enable fusion: Merge signals from multiple sources without losing context.
In other words, good alignment isn’t just a nice-to-have, it’s foundational.
Real-World Example: EEG Signal Alignment
Let’s say you’re working with EEG data. You’ve got electrodes on different parts of the scalp, each capturing electrical activity in the brain. These signals should be synchronized—but in reality, they often arrive slightly out of phase due to things like skull conductivity, electrode placement, or even minor hardware delays.
If you try to interpret these raw signals directly, the patterns look noisy or inconsistent. But by applying a smart alignment method—like Dynamic Time Warping or one of the techniques we’ll cover—you can bring those signals into harmony and reveal meaningful brainwave patterns.
That’s the power of alignment: It turns raw noise into insight.
How Do We Align Signals?
Now let’s get into the actual methods. Over the years, I’ve used a range of techniques depending on the type of data and the nature of the misalignment. Here are the four approaches I trust the most, each with its own strengths:
Prominent Methods
- Cross-Correlation
- Mean Squared Error (MSE)
- MSE + Local Phase Variance
- MSE + FFT-Based Phase Variance
Let’s break them down!
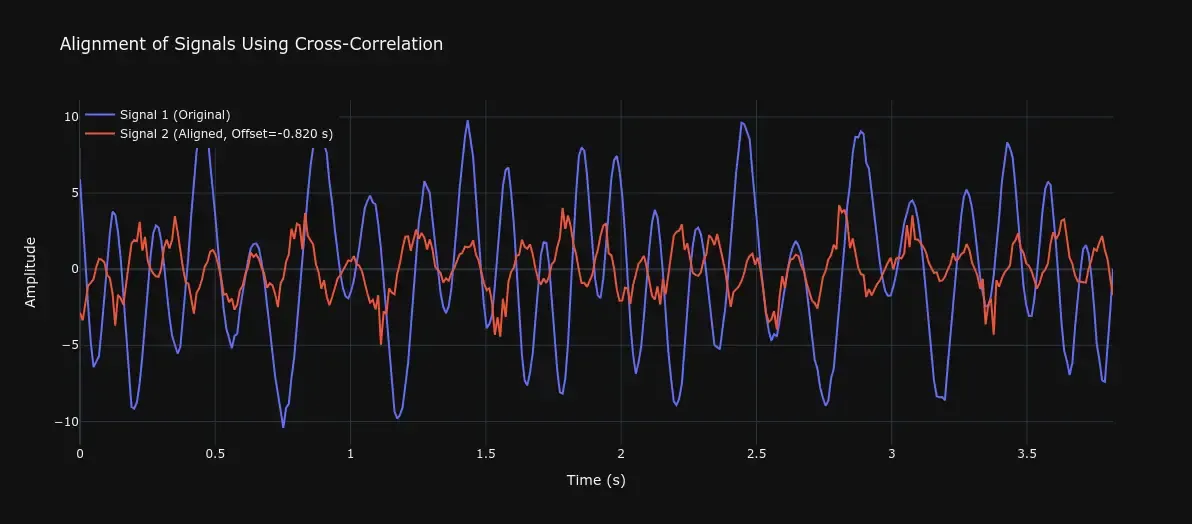
Method 1: Cross-Correlation
Imagine sliding one signal past the other until they “click” into place—that’s essentially what this method does. It calculates how similar the signals are at different time shifts and picks the position where they match best. Great for simple time delays.
Logic
- Compute the cross-correlation:
- : Reference signal
- : Signal to shift
- : Lag (shift amount)
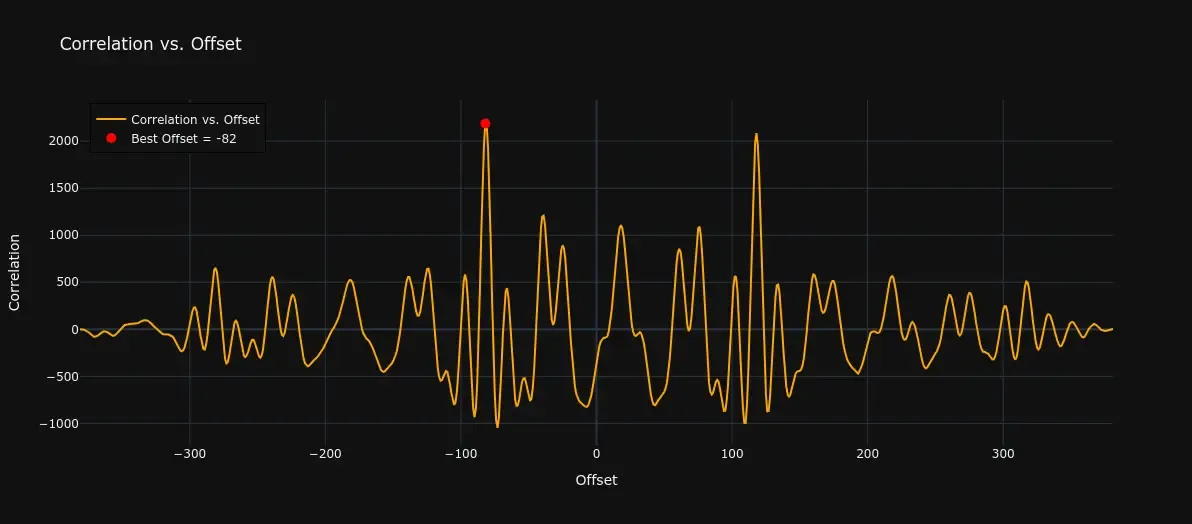
- Spot the lag with the highest value—that’s your match!
- Shift the second signal into place.
For code implementation Follow the Link
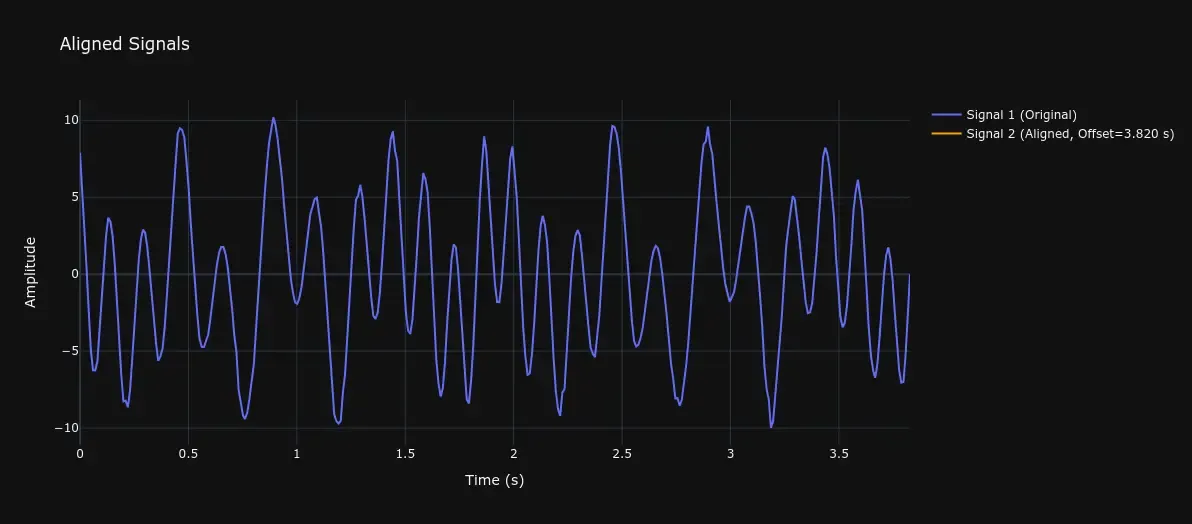
Visualizing the Results
Figure 1: Original signals (top) and aligned signals (bottom) using cross-correlation. Signal 2 slides to match Signal 1 like a glove!
Best for: Perfect for noisy or repeating signals—like audio or radar.
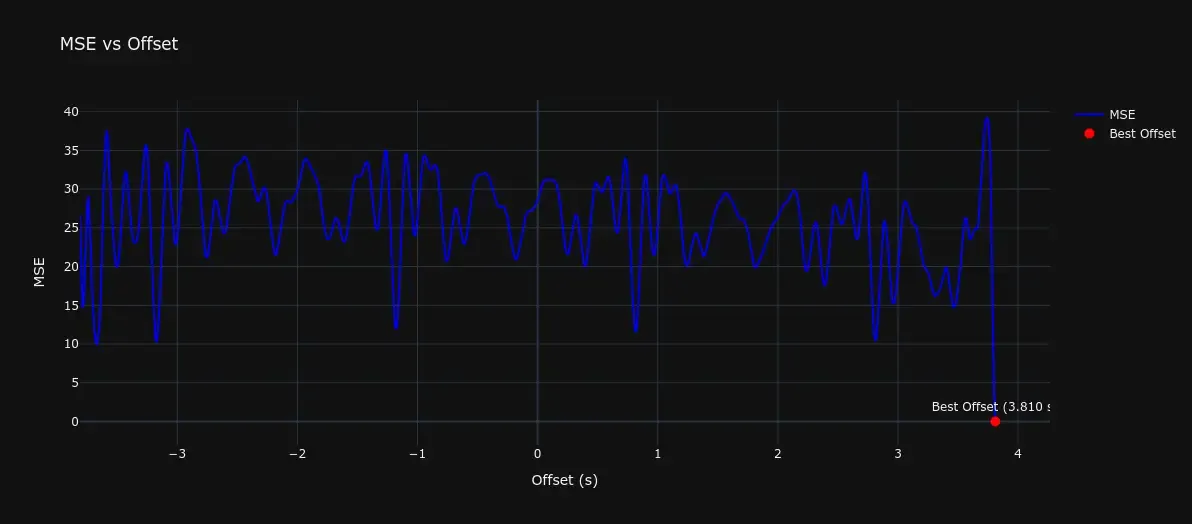
Method 2: Mean Squared Error (MSE)
MSE is all about reducing the gaps between signals. It treats alignment like an optimization problem—testing different shifts and keeping the one where the signals overlap most cleanly. Unlike cross-correlation, MSE cares about both timing and amplitude mismatches, making it better for fine-tuning.
How It Works
- Try a range of shifts.
- For each, calculate MSE:
- : Number of samples
- : Reference signal value at index
- : Shifted signal value at index
- Grab the shift with the lowest MSE.
For code implementation Follow the Link
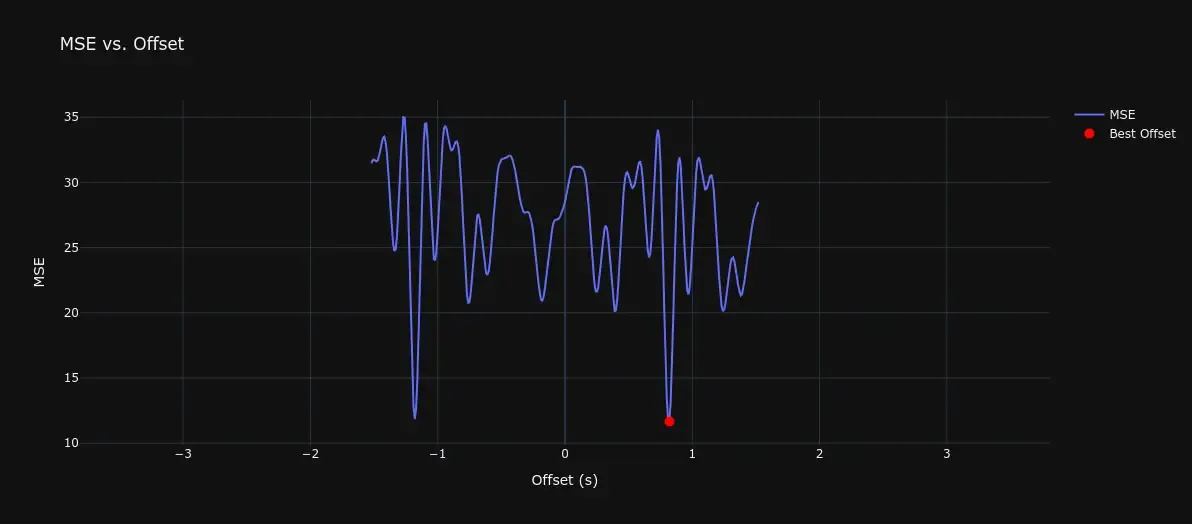
Visualizing the Results
Figure 2: Aligned signals (top) and MSE vs. offset plot (bottom). The red line shows the sweet spot with minimal error.
Best For: It’s precise and sensitive to even the smallest mismatches—perfect when you need detailed alignment.
But what if timing’s off too, and we are losing signals? Next step!
Keeping Signal Loss in Check (Why 40% Matters)
Ever drop half a sentence on a call? That’s signal loss. Here’s why we care:
- Pattern Preservation: Losing chunks (like EEG peaks) can distorts critical patterns.
- Feature Clarity: Important features—such as harmonics in audio or inflection points in physiological data—need to remain intact for accurate analysis.
- Error Control: In real-time systems, uncorrected loss can accumulate quickly, leading to degraded performance or unstable behavior.
So, we set a threshold—like —to keep loss low. If more than of the signal vanishes, our alignment might miss the mark. By tweaking methods (e.g., adjusting , , , or weights), we ensure most of the majority of the signal remains usable and meaningful.
For code implementation Follow the Link
Visualizing the Results
Figure 3: Signal loss impact—misalignment without control (left) vs. cleaner sync with a 40% cap (right).
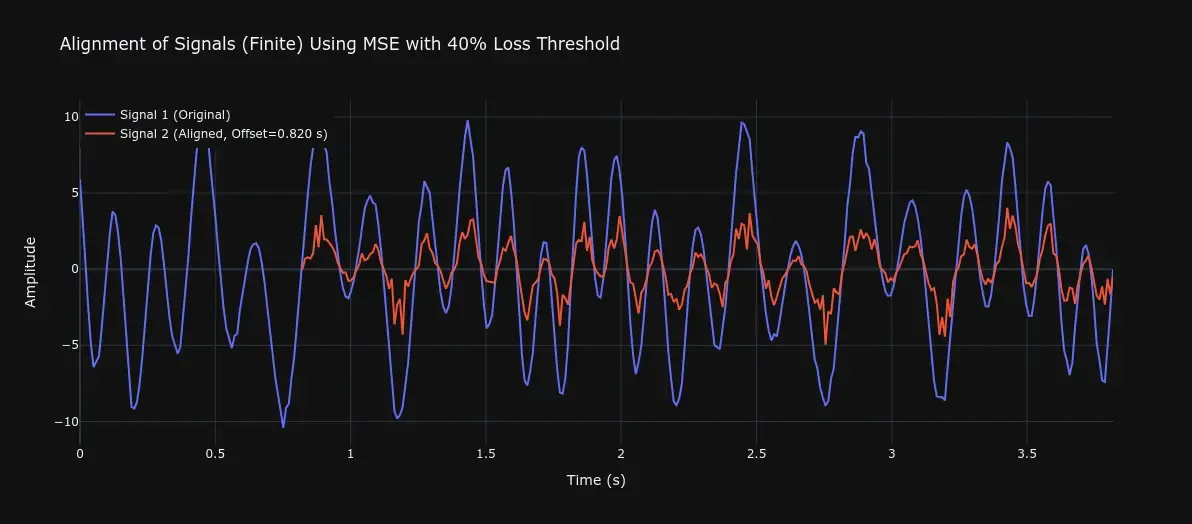
Why 40%? It’s a sweet spot—strict enough to save data, flexible enough for real-world noise.
Method 3: MSE + Local Phase Variance
When signals don’t just shift but also stretch or compress in time (think EEG waveforms or vibration sensors), you need a smarter approach. This method combines MSE with phase tracking—it looks at how much peaks and valleys drift apart locally and corrects for it.
How It Syncs
- Find peaks in both signals.
- Measure phase differences:
- : Time gap between peaks
- : Signal frequency
- Blend with MSE:
- : Weight for MSE
- : Weight for phase variance
- : Variance of phase differences
- Shift to minimize the combined score.
For code implementation Follow the Link
Visualizing the Results
Figure 4: Signals synced with MSE + phase variance. Timing and shape fall into place!
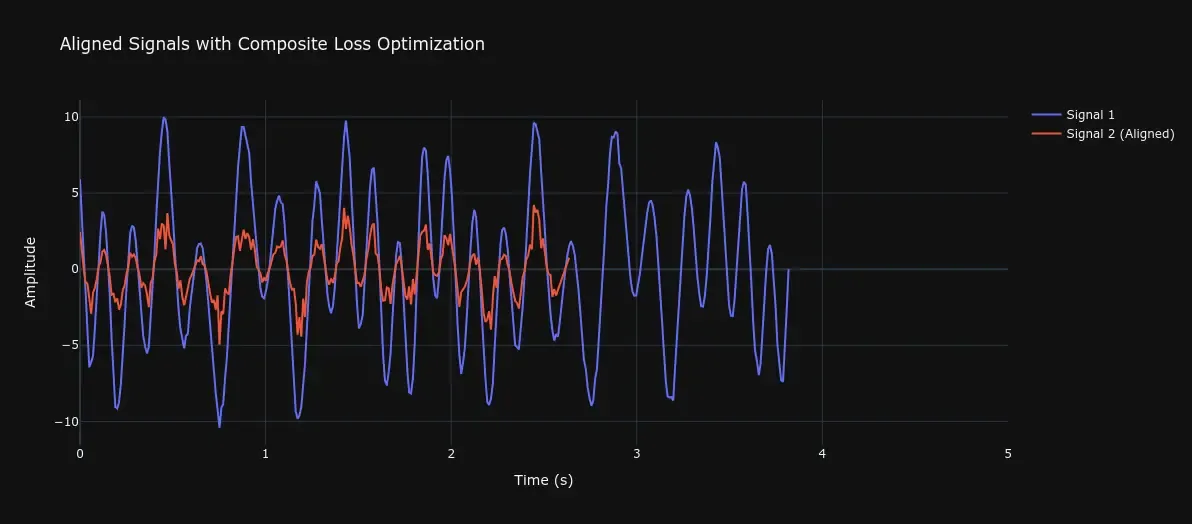
Best For: Signals where both amplitude and phase matter—like EEG data.
Method 4: MSE + FFT-Based Phase Variance
For the toughest cases—signals that speed up, slow down, or have frequency drift—this hybrid method is the heavy artillery. It breaks signals into chunks, analyzes their phase differences in the frequency domain (using FFT), and stitches them back together in perfect sync. More computationally intense, but unbeatable for complex real-world signals.
How It Pulls It Off
- Chop signals into windows.
- Use FFT for phase differences per window:
- : Frequency bin index
- : Fast Fourier Transform of the reference signal
- : Fast Fourier Transform of the shifted signal
- Mix with MSE:
- : Weight for MSE
- : Weight for phase loss
- : Average phase difference across windows
- Shift to the lowest loss.
For code implementation Follow the Link
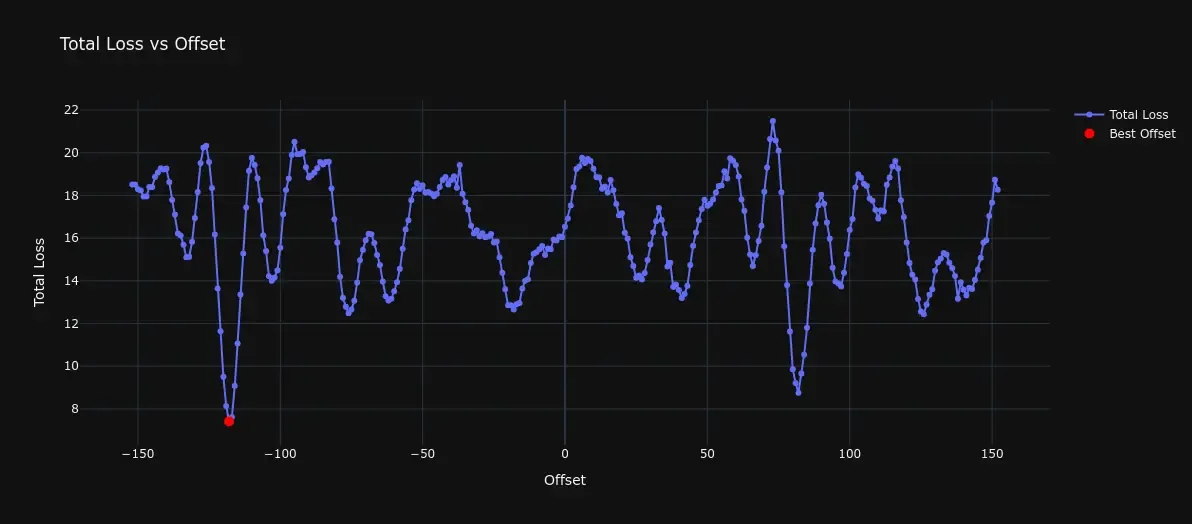
Visualizing the Results
Figure 5: Signals aligned with FFT-based method.
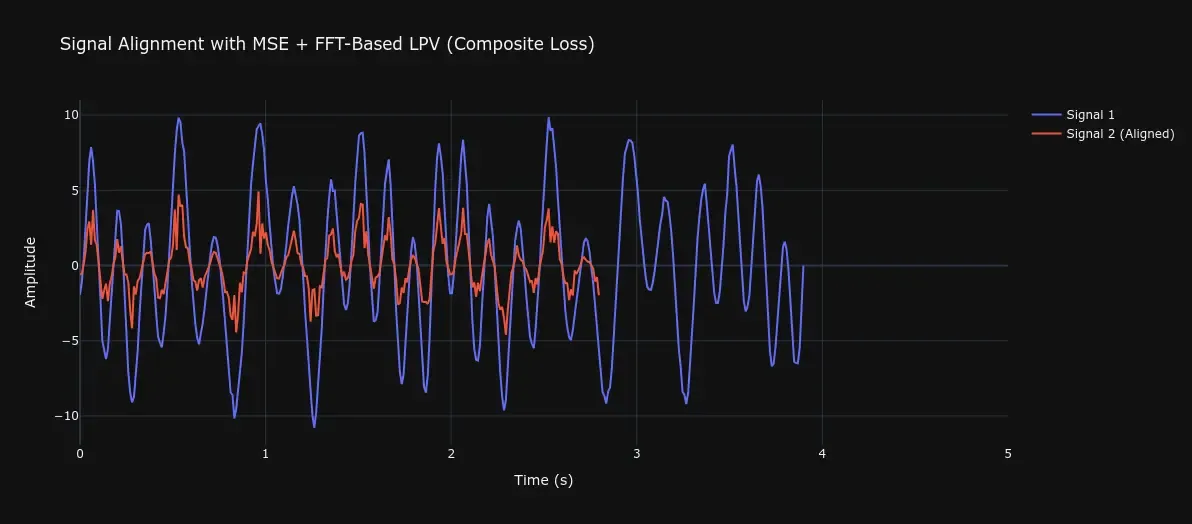
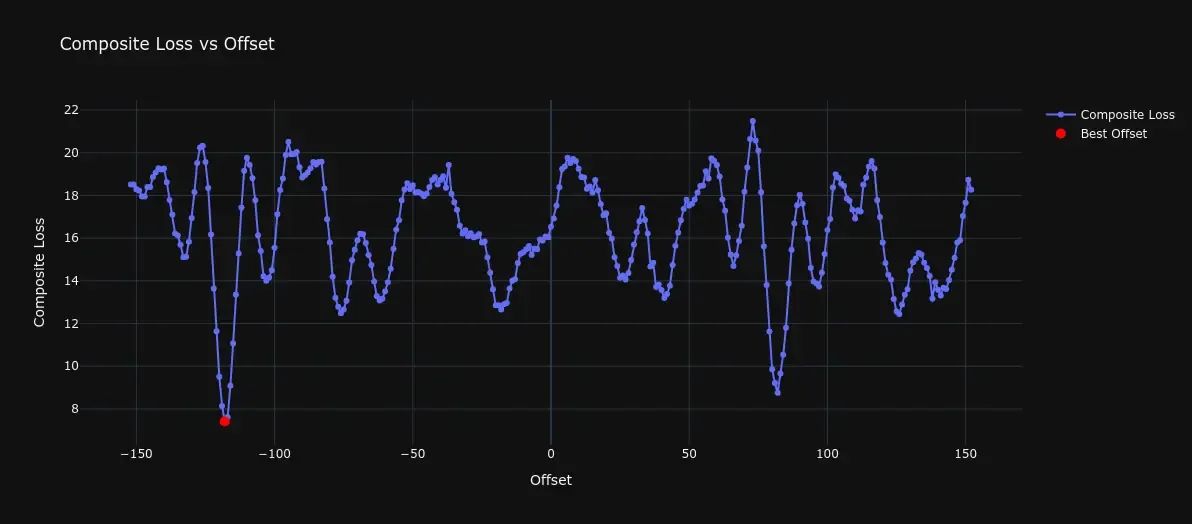
Best For: Subtle misalignments in signals like audio, seismic, or high-resolution biomedical recordings—where both time and frequency matter.
Which Method’s Your Match?
Here’s your go-to guide:
| Scenario | Best Method | Why? |
|---|---|---|
| Simple amplitude match | Cross-Correlation | Fast, loves similarity. |
| Tiny amplitude gaps | MSE | Pinpoints exact differences. |
| Amplitude + small timing shifts | MSE + Local Phase Variance | Balances peaks and gaps. |
| Wild frequency shifts | MSE + FFT-Based Phase Variance | Masters complex timing in chunks. |
Table 1: Pairing methods with signal challenges.
Wrapping Up
Signal alignment may sound like a niche problem, but it’s everywhere once you start looking—from aligning heartbeats in an ECG to synchronizing microphones for spatial audio. And when done right, it transforms noisy, disjointed data into something meaningful.
As a rule of thumb:
- Start simple: cross-correlation or MSE.
- If those don’t cut it, reach for the phase-aware methods.
- Always keep an eye on what you’re trading off: accuracy, speed, or signal loss.
Got some data of your own to sync up? The Signal Alignment GitHub repo has code for all the methods we covered. Feel free to explore, tweak, and apply it to your projects.
And if you hit any roadblocks, I’m always happy to chat.
References
- Oppenheim, A. V., & Schafer, R. W. (2010). Discrete-Time Signal Processing.
- Papoulis, A. (1991). Probability, Random Variables, and Stochastic Processes.
- Rabiner, L. R., & Gold, B. (1975). Theory and Application of Digital Signal Processing.
- Adapted from signal processing literature.
- Cooley, J. W., & Tukey, J. W. (1965). An Algorithm for the Machine Calculation of Complex Fourier Series.
- Hybrid loss function: Custom formulation inspired by signal alignment studies.